Know Exactly How
Your AI Agents Perform
Real-time visibility into every agent, every task, every node. Track completion rates, accuracy scores, runtime trends, and cost efficiency. All in one place. Identify problems before they impact operations. Make decisions based on data, not guesses. Enterprise-grade observability for AI automation.
Complete visibility into
agent performance
Track what matters: completion rates, accuracy scores, runtime trends, and cost efficiency. Real-time dashboards show exactly how your agents are performing. Identify problems before they impact operations. Make data-driven decisions.
Real-time performance dashboards
Six key metrics at a glance: tasks completed, failed, approval rate, average runtime, total runtime, completion percentage. Filter by last 7, 30, or 90 days. Know exactly what's happening, right now.
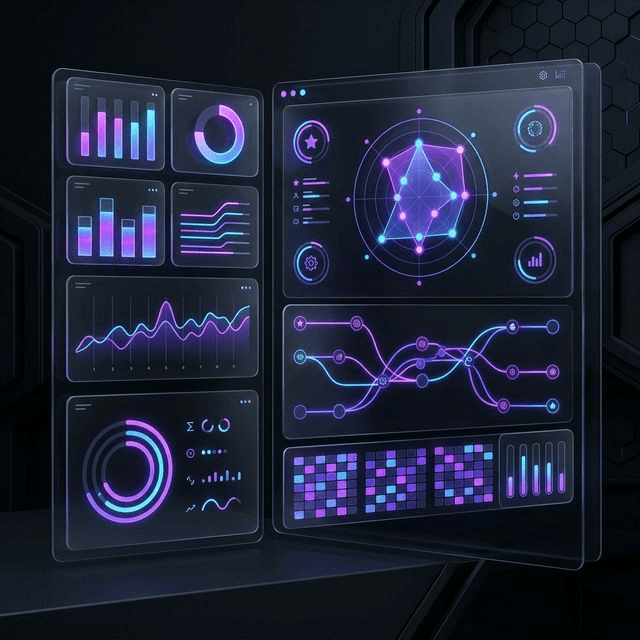
Three-layer accuracy measurement
Workflow accuracy. Step accuracy. Variable accuracy. Know not just that something failed. Know exactly which node, which variable, and why. Surgical debugging, not guesswork.
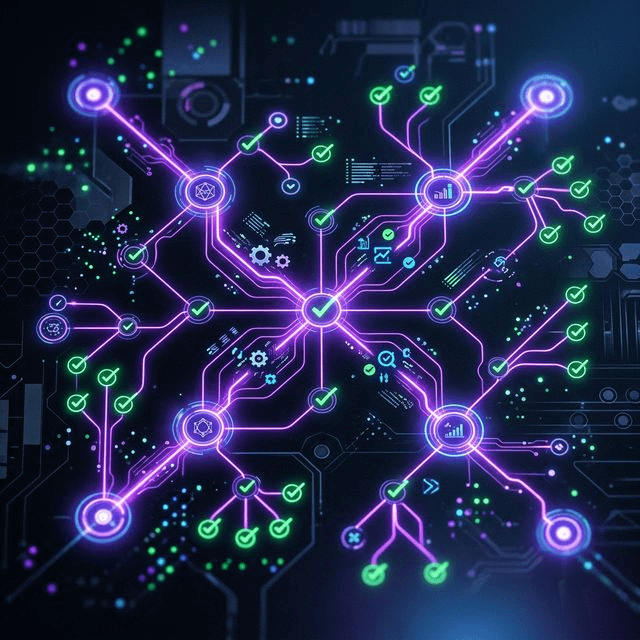
Complete execution tracing
Every task traced from trigger to completion. See inputs, outputs, and decisions at every node. Debug failures in seconds. Understand exactly what happened and why.
LangFuse integration
Deep observability for AI workloads. Token usage tracking. Latency analysis. Model behavior insights. Error pattern identification. Enterprise-grade monitoring for LLM operations.
Cost tracking and optimization
Track tokens used per agent, per task, per node. Identify expensive operations. Optimize prompts to reduce costs. Know your AI spend at granular level.
Learning Hub analytics
Tool-level accuracy tracking across all workflows. See which tools underperform. Click to optimize. Watch improvement over time. Agents that get better, measurably.

Multi-agent fleet visibility
Analytics across your entire agent fleet. Global completion rates. Agent-by-agent comparison. Integration health. One view of your AI workforce.

API access to all metrics
Programmatic access to analytics data. Build custom dashboards. Integrate with existing BI tools. Automate reporting. CI/CD integration for accuracy gates.
Performance dashboards: Metrics that matter
The Analytics dashboard provides real-time visibility into agent performance across six primary indicators. Tasks completed, tasks failed, approval rate (for HITL workflows), average runtime per task, total runtime, and completion percentage. Filter by date range (last 7 days, 30 days, or 3 months) to track trends. Visual gauges show completion rate, average evaluation score, and feedback score at a glance. Per-space analytics show tokens used, executions, nodes processed across your workspace.
Three-layer accuracy: Know exactly where problems occur
ReinforcedX measures accuracy at three levels. Workflow level asks did the entire task complete successfully? Step level asks which specific node in the workflow failed? Variable level asks which individual output field was incorrect? This surgical precision means you don't debug blindly. When invoice processing fails, you know immediately. It was the address extraction node, specifically the zip code field, and here's the exact input that caused it.
Execution tracing: Complete visibility into every task
Every task execution is fully traced from trigger to completion. For each task, see the complete execution timeline. For each node, inspect inputs (what data arrived), outputs (what was produced), and decisions (why this path was chosen). Error messages show exactly what went wrong. Rerun from any point to test fixes immediately. Execution logs are available for debugging, auditing, and compliance.
LangFuse integration: Deep AI observability
LangFuse provides enterprise-grade observability for LLM operations. Complete execution traces across all nodes show the full picture. Token usage tracking reveals cost per operation. Latency analysis identifies slow nodes causing delays. Model behavior insights show exactly what prompts were sent and responses received. Error pattern identification surfaces systematic issues before they escalate.
Learning Hub analytics: Watch improvement over time
The Learning Hub tracks tool performance across all workflow nodes, showing accuracy scores for every tool in your agents. Tools below 90% threshold are highlighted as needing optimization. Compare high-performing tools (100%) with underperformers (50%) to understand improvement potential. Watch accuracy trends over time. Daily, weekly, monthly. See the impact of optimizations immediately reflected in metrics.
Multi-agent fleet visibility: Your AI workforce at a glance
Analytics span your entire agent fleet, not just individual agents. Global view shows total tasks, completion rates, and accuracy across all agents. Agent-by-agent comparison identifies top performers and underperformers. Integration health shows which connectors are functioning well and which have issues. Team and workspace views for organizational visibility. One dashboard for your entire AI operation.
Cost tracking: Optimize AI spend
Track token usage at every level. Per workspace, per agent, per task, per node. See which operations consume the most tokens and therefore cost. Identify expensive prompts that could be optimized. Compare model costs (GPT-4 vs Llama for the same task). Understand cost trends over time. Use data to make model selection decisions. Not the most powerful model, but the right model for each task.
API access to all metrics
Your data belongs to you. Export any performance metric, log, or trace via our comprehensive API. Create custom dashboards in your preferred BI tool (Tableau, Looker, Power BI) using pre-built connectors. Automate scheduled reports for stakeholders. Integrate accuracy gates into your CI/CD pipelines to ensure only high-performing agents reach production.
Start building custom AI agents to automate processes
Join our platform and start building AI agents for various types of automations.
Questions teams ask about analytics
What does analytics actually involve?
We design the workflow, build the agent and the evaluation around it, run it in shadow mode against real traffic, then hand it over with a runbook. You end up owning a running system for analytics plus the evidence it works, not a proof of concept that needs rebuilding.
How long before analytics is live?
Four weeks is the standard implementation: discovery in week one, environments in week two, a shadow-mode pilot in week three, handover in week four. Most teams see their first agent running against real data by week three.
Do we need an ML team to run this?
No. Most clients start with strong software engineers and no ML specialists. The engagement is built so your existing team owns the system afterwards — we train them while we build rather than handing over documentation at the end.
How do you know it is working?
Every system ships with an evaluation suite: golden datasets built from your real cases, rubric-driven scoring, and regression gates in CI. Quality becomes a number you track per release rather than an opinion, and drift pages you the way a failing test would.
What happens when the agent gets it wrong?
Low-confidence and high-stakes cases route to a human queue by design. Every failure is captured with full trace context, and those traces become new evaluation cases, so the same mistake is caught automatically next time rather than recurring.
Does this run in our environment or yours?
Yours. Deployment happens inside your cloud perimeter, against your data stores and your identity provider. We integrate with the stack you already run rather than asking you to move anything into ours.
Who owns what we build?
You do. Fine-tuned weights, datasets, evaluation suites and runbooks are yours, handed over at the end of the engagement. There is no lock-in that requires us to keep the system running.
How is this priced?
A platform subscription plus a fixed-scope implementation fee, quoted in writing before work starts. Implementation is priced by engagement rather than by the hour, so a slower week costs you nothing extra.
We tried something like this before and it failed. Why would this be different?
Most failures are not model failures — they are missing evaluation, no human fallback, and no way to tell whether a change made things better. Those are the parts we build first. If we cannot define how success is measured for analytics, we say so before taking the work.
What do you need from our team?
One process owner who knows the workflow end to end, one engineer with access to the systems being integrated, and a weekly 45-minute review. That is genuinely it — no standing project committee.